In the previous devlog I focused on getting intense multiplayer combat with 1000 units to use just 50kb/s bandwidth. Now it's time to turn to the CPU performance! You can see the results now on the freshly updated CommandAndConstruct.com.
Extraordinary JavaScript performance
In my previous post I noted how JavaScript could blitz through 1,000,000 iterations of a loop in 10ms. I worked out that on my CPU that means each iteration only takes 37 CPU cycles, with a for-of loop, array destructuring, property accesses and a range calculation. It's an example of the truly extraordinary performance of JavaScript. It really does get very close to C/C++ performance, even when you write natural, high-level code. Modern JavaScript engines are amazing.
This actually causes a bit of a problem in that performance is so fast, the framerate is still running perfectly fine, so we can't use the FPS counter to guide optimization. Instead we can use Chrome's excellent performance profiler to make measurements so we target the right parts of the code, and ensure any changes make a meaningful difference.
Initial measurements
Having been programming many years now, I strongly suspected what the culprits would be: the range-checking loop - which makes O(n²) checks as every unit has to check every other unit - and collision checks on projectiles, which have a similar problem of every projectile constantly checking every unit. However when investigating performance, never guess - always make measurements!
First I just profiled the game after startup with nothing happening. Here's what the profile showed.
 A Chrome DevTools performance profile of the GameServer thread with nothing happening in the game.
What are we looking at here? The profiler has different views providing different ways to investigate results, but the main view is a "flame chart", showing time horizontally, and nested JavaScript calls moving down vertically. This is a good starting point to see which function calls are taking the most time.
There are actually three separate rows here - recall this game uses a multithreaded architecture. Chrome's profiler also supports multithreading with web workers, so we get a nice overview of work on all the active threads. The picture above shows all three main rows - the browser main thread, Construct's runtime in its own web worker, and GameServer running in its own web worker too. Only the GameServer row is expanded, since that is the thread that we're looking at optimizing at the moment.
This measurement confirms what I suspected. Even with nothing going on, virtually all the CPU time on the server is spent in #FindTarget(), a method called for every unit to check if any of the other units are within its range. So let's make that faster.
Optimizing range checks
The main principle to optimize range checks is to make sure each unit only checks other units in its general vicinity. Very far away units should not be considered at all - not just immediately skipped in a loop, but not iterated at all. How do we do that?
There are all sorts of fancy data structures that can solve problems like this, but there's a really simple one that works great, and as I've said before, the simplest solution that works is usually the best. The solution is what I call collision cells, or may be referred to as "buckets" in other places. It works like this:
- Divide up the level in to large-ish boxes, say 2000x2000.
- Track which box - aka collision cell - each unit is in, moving it between cells as it moves.
- When checking for units - either for range checks or collision detection - work out which collision cells cover the relevant area, and only check their contents.
Here's what the level looks like split in to 2000x2000 boxes.
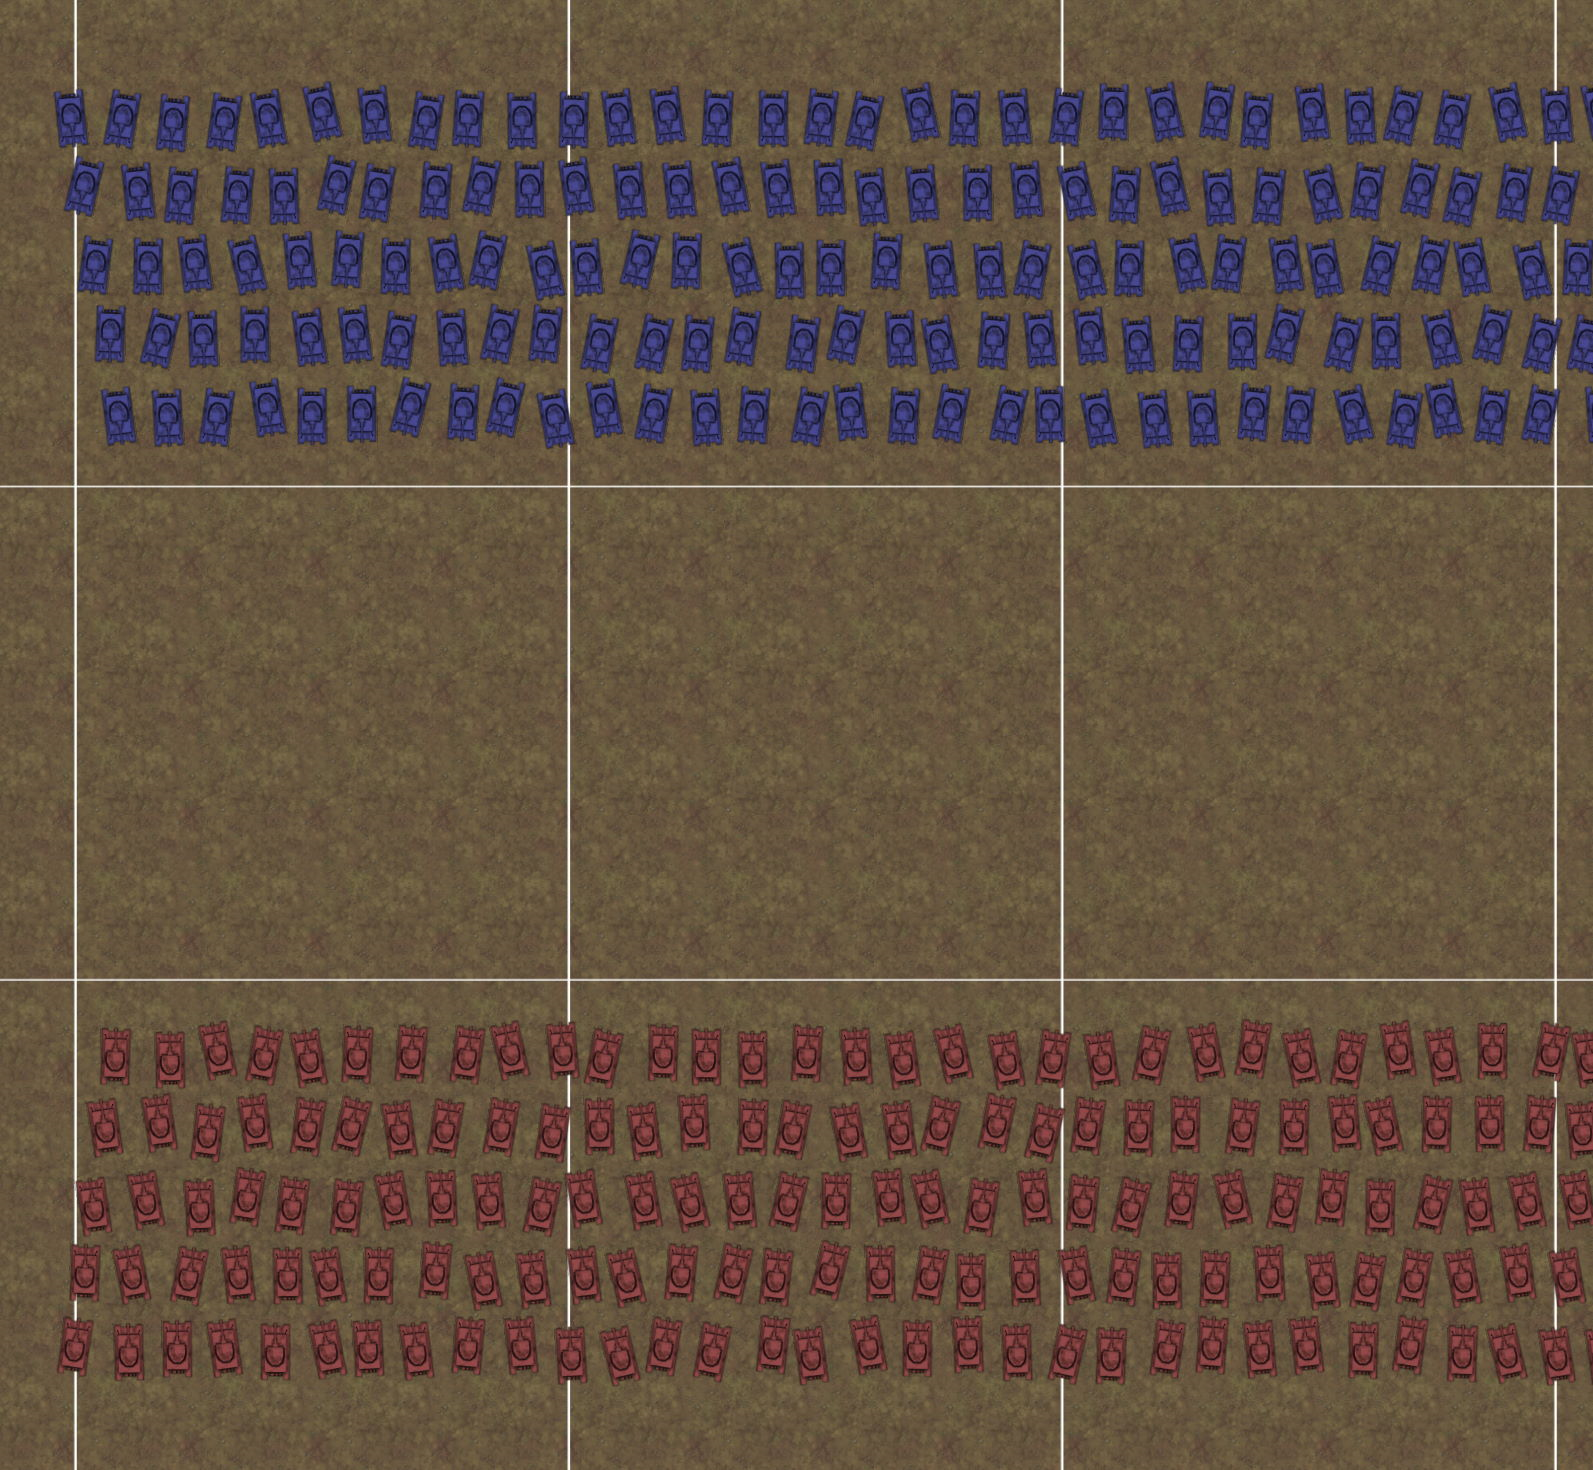 The level split in to large collision cells, shown with white lines. When making range or collision checks, only the content in relevant cells needs to be checked.
This is a nice and simple scheme and ensures far-away things never need checking at all. It is in fact the algorithm Construct uses in its own collision engine, and combined with exceptional JavaScript performance it's proven so effective that collision performance has pretty much never been a problem for Construct games. I blogged about the collision cell optimization in Construct way back in 2013 when we first implemented it in Construct 2 where you can learn more about it.
As you'll recall from the architecture blog post, making use of multithreading necessitates a separate implementation of collisions for the server thread. I could of course have chosen to use the built-in collisions provided by Construct, which also use a collision cells optimization, but that would mean not using multithreading, and one of the goals of this project is to drive performance to the max. So to do that I've decided to make the trade-off of using multithreading, and writing some barebones collision code for the server thread. Many games will of course use Construct's built-in collisions and that's great! I'm taking a different direction for this project though, to see how far we can push performance. Can we have 10,000 units in combat? 50,000? Even more? Multithreading is an essential part of making that possible, which is why I've made the trade-off this way for this project.
Implementing collision cells
GameServer now has a collisions/ folder with all the relevant collision code in it. CollisionGrid stores the 2D array of collision cells, each of which has a Set for its content. Sets are great for this as items don't need to be ordered, and can be efficiently added and deleted at random. Arrays are less suitable as inserting and deleting items requires shunting along all the following items, which done repeatedly will again lead to O(n²) performance.
CollisionBox is a small helper class that just takes an object and its rectangle, and tracks which collision cells that object is in. Note that an object can be in multiple collision cells if it's overlapping cell borders; this turns out not to be a significant problem, but it's worth being aware of. The performance cost of moving units between collision cells is negligible - since the collision cells are large units almost always remain in the same cell, even while moving, and so most of the time nothing needs updating.
So there we have it - just 180 lines of code to efficiently handle collisions. The real magic happens in CollisionGrid's ForEachItemInArea() method: this takes a rectangle, and runs a callback for every object in all the collision cells covering that area. I first wrote this as a generator function that used yield to iterate all the content; however from profiling I found that had a surprisingly high performance overhead, and using a callback was much faster. This is, so far, the only time I've had to adjust the code from what I preferred in order to increase performance.
Range check optimized results
Now the brute-force loop in the #FindTarget() can be updated to use collision cells. See the call to ForEachItemInArea() in unitTurret.js for the relevant code. It now calculates a large rectangle that fits the entire circular range area, and iterates just the content inside the collision cells covering that area. Then the logic in the callback is mostly the same as the previous body of the loop, ignoring units from the same player, and queuing up units that are found in range.
This is an enormous performance improvement. I found the top-left unit only needed to check 52 other units, whereas previously it had to check 1000. So about 95% of the checks have been eliminated! Let's confirm results with measurements in the profiler again.
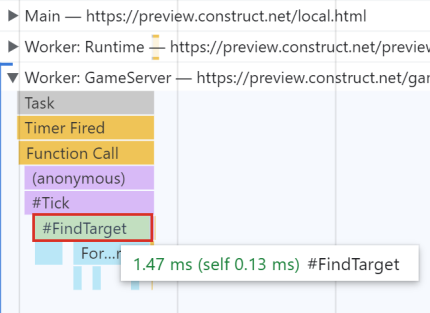 The Chrome DevTools performance profile of the GameServer thread with nothing happening in the game, after the collision cells optimisation for range checks.
There we have it: calls to #FindTarget() used to take ~11.6ms, and now take ~1.5ms - about 87% faster. This runs well even on a mobile phone.
More importantly, this is algorithmically more efficient. Previously the performance cost was exponential, so adding more units would have quickly become prohibitively slow. Now the performance cost should be approximately linear, assuming a large level with content reasonably consistently distributed across it. This will allow the game to scale much further than it could have before.
Optimizing projectile collisions
Next up I set up some intense combat and took another performance profile. My second suspect came up in the measurements this time, confirming my intuition.
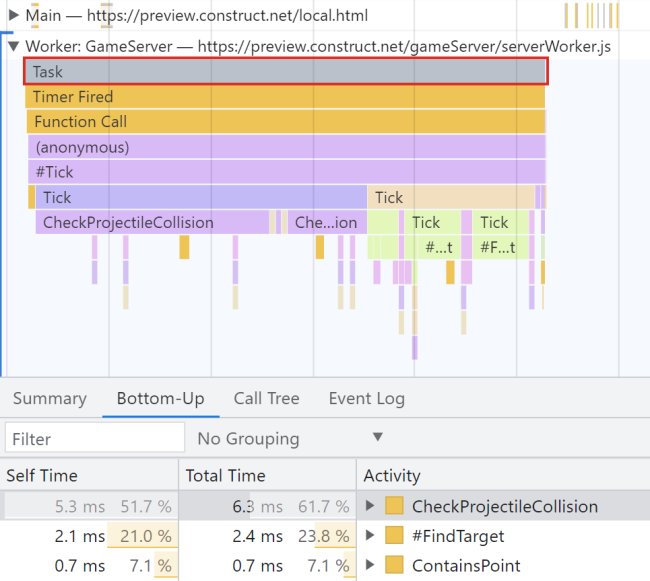 Chrome DevTools performance profile of GameServer thread in intense combat.
This time there's more going on in the flame chart, so I also popped open the "bottom-up" panel for the whole server tick (the top duration labelled "Task"). This shows a table of the functions that took the most time over that time period. This makes it clear that checking projectile collisions is taking about 60% of the duration of the tick, topping the table. This isn't surprising as it's a similar problem to the range check: if there are 500 projectiles and 1000 units, every projectile will check against every unit, which means 500,000 checks every tick. It's another case of O(n²) performance which will become prohibitively costly as the scale of the game increases.
This time the relevant method is CheckProjectileCollision() in GameServer. The solution is similar to before: previously it would iterate all units in the game to see if the given projectile collided with any of them. Now it calls ForEachItemInArea for just the projectile point, and it only checks the units in the collision cell at that point.
One minor difference is the callback can't directly stop the loop in ForEachItemInArea, and once a collision is found we want to stop iterating. So the callback can return true to tell ForEachItemInArea to break its loop. The call to CheckProjectileCollision has its own return value, which is set by assigning a variable in the callback.
Let's try another profile with intense combat again.
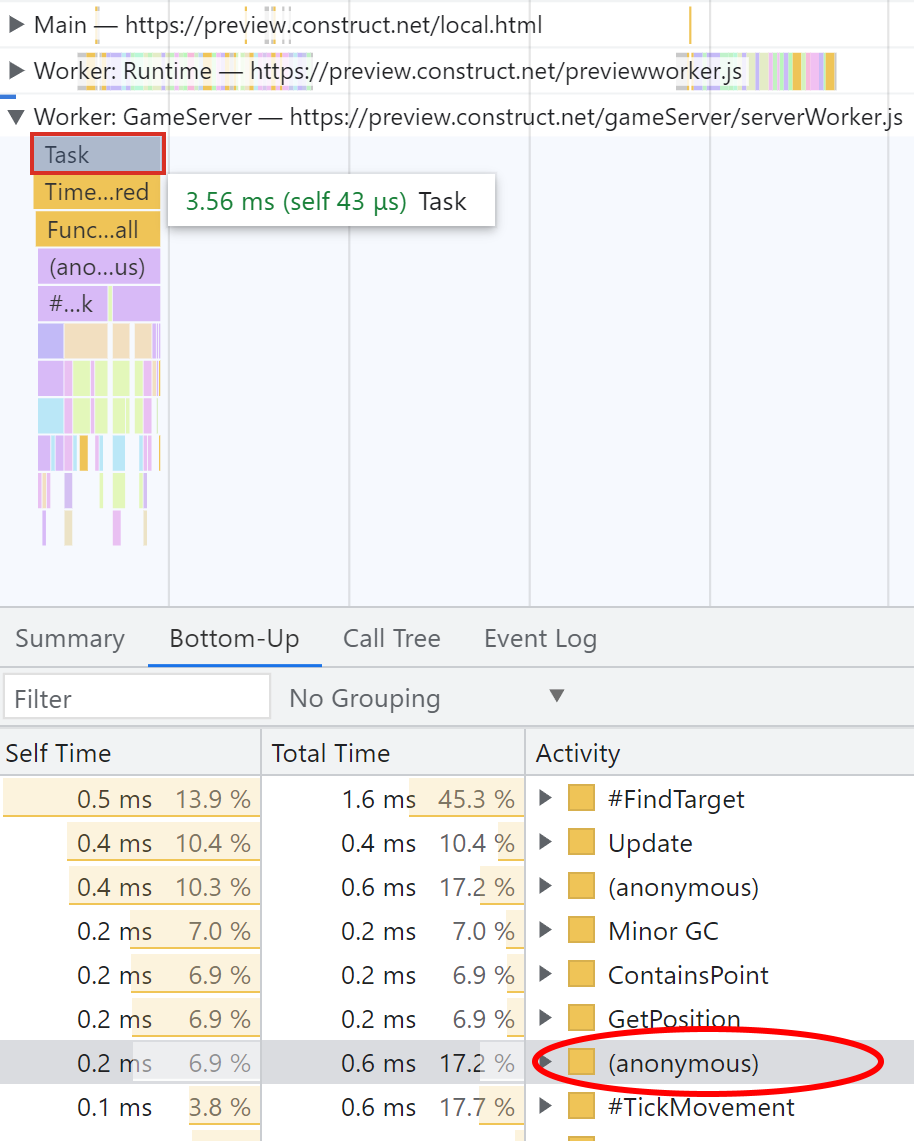 Chrome DevTools performance profile of GameServer thread in intense combat, after optimizing projectile collisions.
Now CheckProjectileCollision() has fallen right down the table - it's not even in the picture! The callback to ForEachItemInArea does come up (circled in red as an anonymous function, as arrow functions have no name), but it's way down the table, using much less CPU time. The overall tick time is much reduced, and target finding is back at the top of the table. This makes sense as there are more units than projectiles and ranges cover a much larger area than just a projectile point. However range finding is still efficient enough that the tick time is only a few milliseconds, and the fact projectile collisions have fallen right down the table shows that it's job done - it's no longer a major performance cost.
Conclusion
With a simple "collision cells" optimization scheme, the overall CPU time of the server thread has been brought down by about 90%. Importantly, it's even better than that, as adding more content should increase CPU usage approximately linearly rather than exponentially. So now partly thanks to JavaScript's exceptional performance, we have super efficient code for handling huge games! We've also seen how Chrome's performance profiler is a very useful tool for investigating performance, and even has support for multithreaded profiles. This demonstrates one of the many strengths of the web platform: you get sophisticated development tools for free, which even work well for game development purposes.
I'm currently at just over 100 commits over two months as a part time project. As things stand, you can have intense multiplayer battles with 1000 units, and it uses just 50kb/s bandwidth, and only a few percent of CPU usage. See it for yourself at CommandAndConstruct.com.
I'm really pleased with this result so far! I've got a highly efficient foundation to start building some more exciting gameplay features on top of, and with more work it could potentially scale to ridiculous battles involving maybe even ten thousand units. I think this is a good point to have a short break and take stock of where we've come, so the next blog will be a round-up summary. In the mean time, take a look at the GitHub project where you can browse all the code and see how it's all done so far.